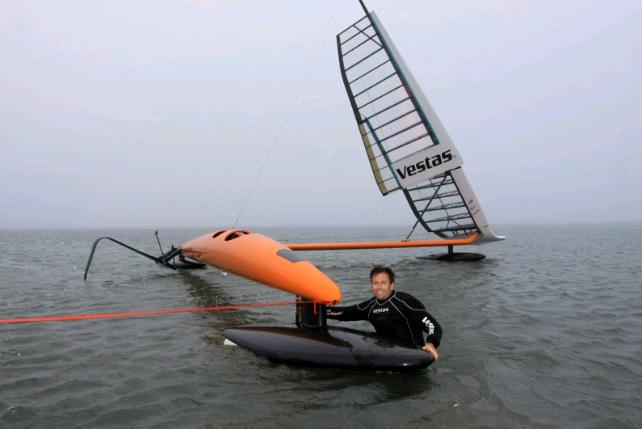
Bicycle Trailer with Solar Panel Charges Electric Bicycle

Bicycle Trailer with Solar Panel Charges Electric Bicycle

“The electric bicycle has become a very long way in recent years. However, the lack of luggage space and limited range of the battery makes the electric bike less suited to long distances. Solarwind, designed by architect Raf Van Hulle, offers a solution.

The trailer provides extra luggage space and is fitted with a solar panel to keep the electric bicycle’s battery charged.”

Solarwind.

How to Carry a Foldable Workshop on The Rear Rack of Your Bicycle

foldable workshop

Instruction manual. Thanks to Berto Aussems.

Finally: A Life Cycle Analysis of Electric Cars

Trexa-ev3“We develop and provide a transparent life cycle inventory of conventional and electric vehicles and apply our inventory to assess conventional and EVs over a range of impact categories. For all scenarios analyzed, the use phase is responsible for the majority of the global warming potential (GWP) impact, either directly through fuel combustion or indirectly during electricity production.”

Total emissions

“When powered by average European electricity, EVs are found to reduce GWP by 20% to 24% compared to gasoline ICEVs and by 10% to 14% relative to diesel internal combustion engine vehicles (ICEVs) under the base case assumption of a 150,000 km vehicle lifetime. When powered by electricity from natural gas, we estimate EVs offer a reduction in GHG emissions of 12% compared to gasoline ICEVs, and break even with diesel ICEVs. EVs powered by coal electricity are expected to cause an increase in GWP of 17% to 27% compared with diesel and gasoline ICEVs. Wind power electricity would allow electric transportation with life cycle carbon footprints as low as 106 g CO2-eq/km.”

Vehicle production: Manufacturing one electric car takes as much energy as manufacturing two conventional automobiles

“In contrast with ICEVs, almost half of an EV’s life cycle GWP is associated with its production. We estimate the GWP from EV production to be 87 to 95 grams carbon dioxide equivalent per kilometer (g CO2-eq/km), which is roughly twice the 43 g CO2-eq/km associated with ICEV production. Battery production contributes 35% to 41% of the EV production phase GWP, whereas the electric engine contributes 7% to 8%. Other powertrain components, notably inverters and the passive battery cooling system with their high aluminum content, contribute 16% to 18% of the embodied GWP of EVs.”

Comparative Environmental Life Cycle Assessment of Conventional and Electric Vehicles“, Troy R. Hawkins, Bhawna Singh, Guillaume Majeau-Bettez, Anders Hammer Strømman, in “Journal of Industrial Ecology”, October 2012. Via the BBC and Treehugger. Picture: Trexa. Previously: The status quo of electric cars: better batteries, same range

Cargo Cycles Database

Cargo cycles databaseYes, it’s written in German. But nowhere else will you find such a complete database showing and describing all cargo cycles available on the market today.

Moreover, the information is easy to navigate and you can consult the specifications of the vehicles without even a basic knowledge of foreign languages. The description of most models also includes a link to the website of the manufacturer. Check out the Nutzrad Cargo Cycle Database

Read more:

Cargo cyclists replace trucks drivers on European city streets.

Sailing 10,000 Nautical Miles Using the Stars, Moon and Sun

Te-aurere-wakaA group of intrepid Māori sailors from New Zealand will take on the world’s biggest ocean, the Pacific, in an attempt to sail to Easter Island, the most remote inhabited place on Earth, without GPS, charts, maps, or even a compass.

Instead the group will be guided by the traditional techniques that helped the Polynesian people traverse the wide expanses of the Pacific and settle the islands of Hawaii, New Zealand and Tonga, to name just a few – techniques like the movement of the stars, the sun and moon, oceanic currents and bird and animal life.

The sailing odyssey is part of an effort by Polynesian academic and cultural groups to reclaim the navigational knowledge of their forebears, much of which was lost after European colonization.” Read more (official website). Previously: Polynesian stick charts / Satellite navigation in the 18th century / Developed nations dangerously over-reliant on GPS.

The European Railways Network 1870 – 2000

These five maps, based on GIS data and made by the Department of Geography and Sociology of the University of Lleida (Spain), show the evolution of the European railways infrastructure in the 19th and 20th centuries.

[Read more…]